MACD Trading Strategy: How to Spot Buy and Sell Signals
Written on June 2, 2025 By admin in Uncategorized
Understanding MACD
The Moving Average Convergence Divergence (commonly referred to as MACD) stands as a celebrated tool among traders and investors. It is a technical indicator utilized for the purpose of indicating potential buy and sell moments in the market. This indicator is integral in examining the difference between two critical exponential moving averages (EMAs), ultimately acting as a beacon for momentum direction, the strength and duration of market trends, and any imminent changes therein.
Components of MACD
At the heart of the MACD indicator lie three pivotal components:
MACD Line: At its core, the MACD line represents the difference between the 12-period EMA and the 26-period EMA. Its primary role is to act as a gauge for momentum and trend direction, showing traders whether momentum is increasing or decreasing in the context of the asset’s current state. Given its significance, the MACD line is the most examined part of this indicator in trading circles.
Signal Line: In tandem with the MACD line is the signal line, which is essentially a 9-period EMA of the aforementioned MACD line. When charted alongside, it plays an essential role in offering trading signals; these are triggered when the MACD line crosses through or over it. The points of intersection can generate cues to buy or sell, depending on the direction of the crossover.
Histogram: The histogram aspect of the MACD is a visual representation, capturing the divergence or convergence between the MACD line and the signal line. Depending on its position relative to the zero line, it provides insight into the market’s current momentum—demonstrating bullish momentum when above and signaling bearish trends when below. This visual tool aids traders in quickly assessing market conditions without the need to interpret numerical data.
How to Interpret MACD Signals
Understanding MACD signals involves interpreting crossovers, noticing divergences, and recognizing historical extremes.
MACD Crossover
Among the most prevalent trading signals derived from the MACD indicator are crossovers. These occur when the MACD line intersects with the signal line, either climbing above or dropping below it.
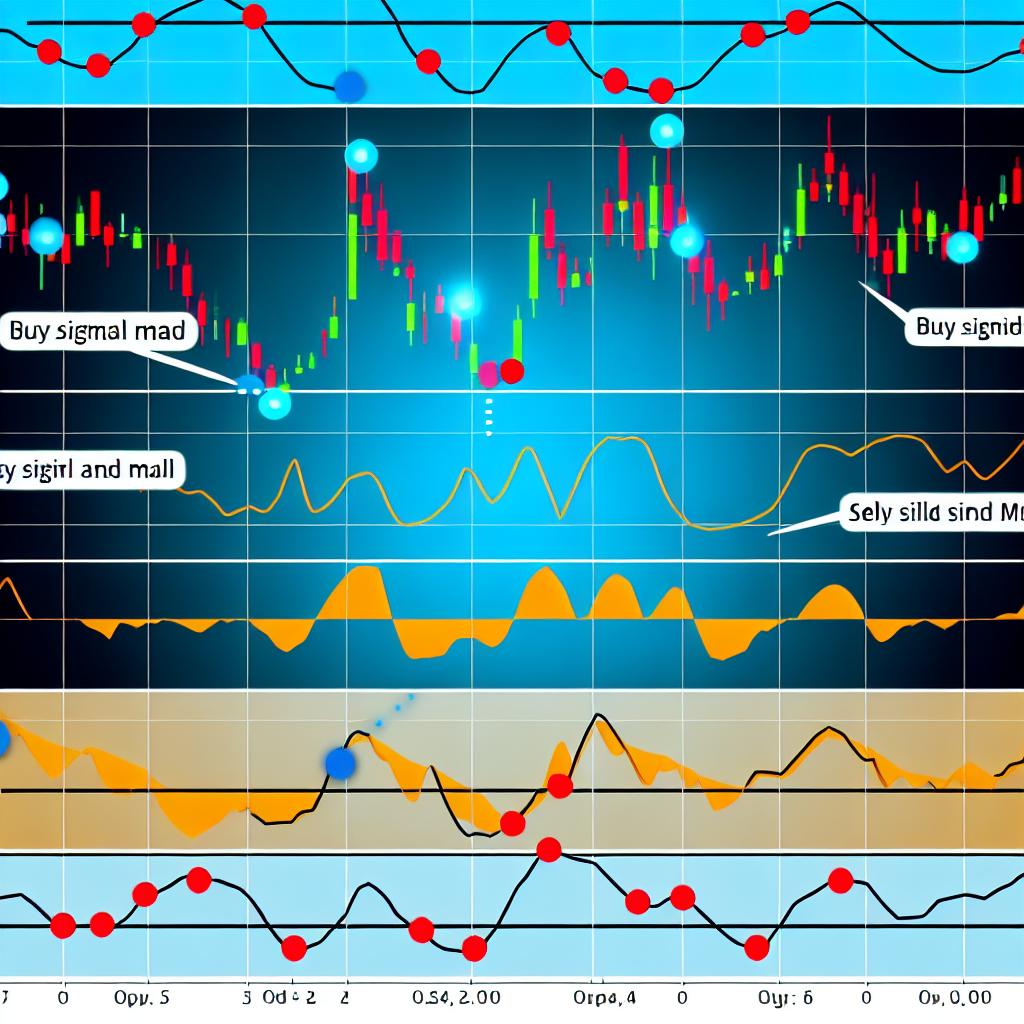
– Buy Signal: A buy signal emerges when the MACD line rises above the signal line. This phenomenon suggests growing upward momentum, prompting traders to consider purchasing the asset to capitalize on potential price rises.
– Sell Signal: Conversely, when the MACD line descends below the signal line, a sell signal is generated. This implies that the market may be experiencing downward momentum, advising traders that it could be prudent to sell the asset to avert potential losses from price drops.
Divergence
Divergence is a phenomenon where the MACD line diverges from the underlying asset’s price path, offering insight into potential market reversals.
– Bullish Divergence: Bullish divergence occurs when the MACD line makes higher lows while in contrast, the asset’s prices are making lower lows. This scenario typically suggests that the selling pressure is waning, hinting at a possible uptick in prices in the near future.
– Bearish Divergence: On the opposite end, bearish divergence presents itself when the MACD line makes lower highs, whereas the asset’s prices are reaching higher highs. This scenario indicates potential weakening of bullish momentum, arguably foreshadowing an impending price decline.
Historical Extremes
In addition to crossovers and divergences, the MACD also provides insights into the market’s potential overbought or oversold states via the analysis of historical extremes.
– Overbought Condition: An overbought condition is suggested when the MACD line is noticeably above the zero line, indicating potential overheating in the market and hinting at an impending price correction or pullback.
– Oversold Condition: Alternatively, when the MACD line moves significantly below the zero line, it may denote an oversold condition. In such instances, a potential increase in prices might be anticipated, offering a buying opportunity as the market corrects itself.
Implementing a MACD Trading Strategy
Despite the strength and versatility of the MACD, an effective trading strategy often benefits from coupling it with additional tools and analyses. Here are streamlined steps to employ a MACD-based trading strategy efficiently:
Set Your Time Frame: Selecting the appropriate time frame is fundamental. It varies according to a trader’s style and objectives, whether one is involved in intraday, daily, or weekly trading. This initial step establishes the basic context in which trading decisions will occur.
Identify Crossovers: Once the time frame is decided, vigilance is key to spotting when the MACD line crosses its signal line. These crossovers serve as valuable indicators for potential buy or sell actions, according to their nature.
Monitor Divergences: Traders must remain vigilant for any divergences between the asset’s price movement and the MACD indication. Recognizing these can be instrumental in predicting and responding to potential trend reversals in a timely fashion.
Use Stops and Limits: Regardless of the apparent clarity of signals offered by MACD, utilizing stop-loss and take-profit orders remains crucial. These ensure that risk management protocols are upheld, safeguarding trades against unpredictably volatile market movements.
It is fundamental to comprehend that the MACD, while highly informative, is not infallible or standalone. To mitigate risks inherent in trading, combining MACD signals with robust risk management strategies and comprehensive market analyses is advantageous. For further information and enriched learning on trading methodologies, resources like Investopedia offer well-rounded insights into these and other trading tools.
This article was last updated on: June 2, 2025