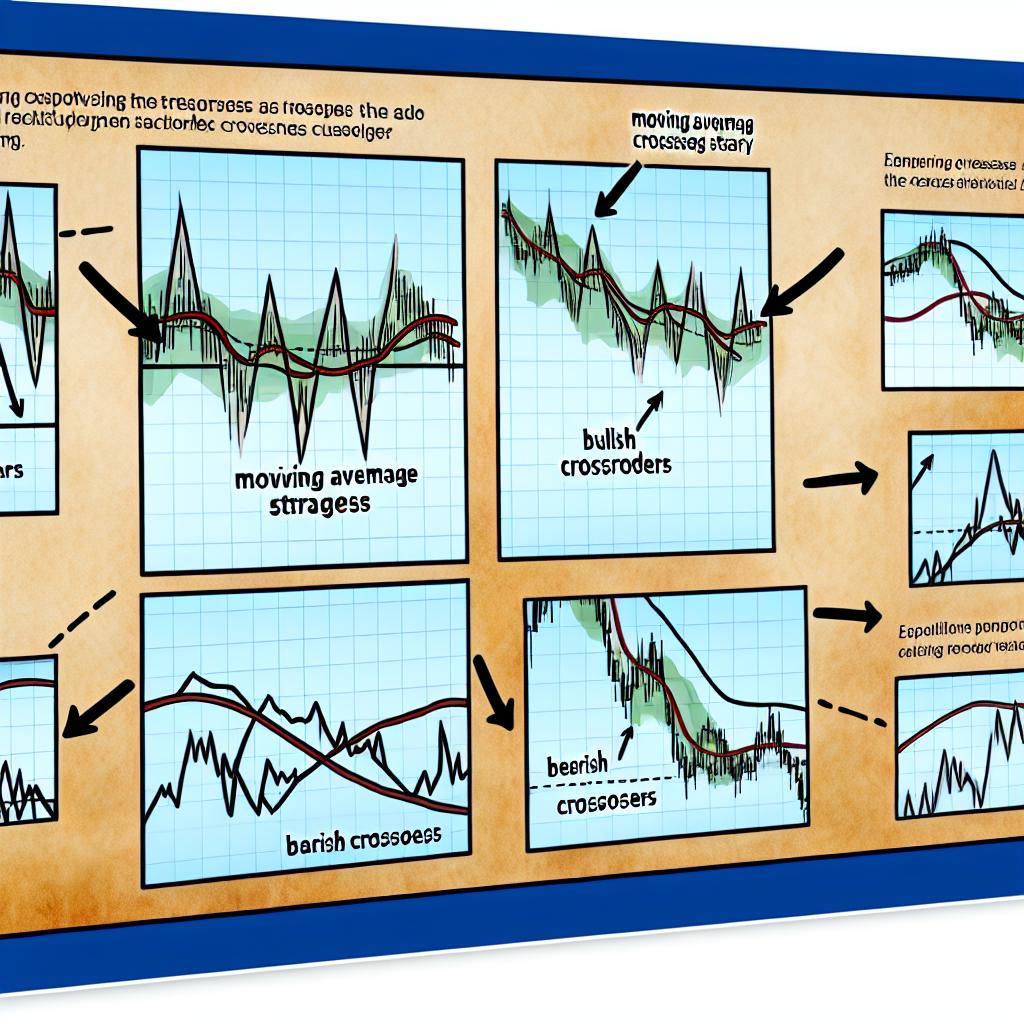
Moving Average Crossover Strategy: How to Identify Trend Reversals
Written on July 7, 2025 By admin in Uncategorized
Understanding Moving Average Crossover Strategy
The Moving Average Crossover Strategy is a crucial tool in the toolkit of many traders engaged in technical analysis. At its core, this strategy seeks to identify potential trend reversals, which can offer opportunities for entering or exiting positions in various financial markets. The elegance of the strategy lies in its simplicity—it employs two moving averages, typically a shorter-period moving average and a longer-period moving average, to generate actionable trading signals. Due to its straightforward nature and effectiveness, it has gained substantial popularity among traders, from novices to seasoned professionals.
How Moving Averages Work
Moving averages are classified as lagging indicators, meaning they rely on historical price data and are used to smooth out fluctuations in price, effectively illuminating the underlying trend direction. This makes them invaluable in distinguishing the actual trend from the noise. There are several types of moving averages, but the two most frequently utilized are the simple moving average (SMA) and the exponential moving average (EMA).
The SMA is computed by calculating the arithmetic mean of a set of prices over a specific period. For example, a 20-day SMA involves summing up the closing prices over the past 20 days and dividing that sum by 20. The EMA, on the other hand, gives greater emphasis to more recent prices, which makes it more sensitive to new price information and potentially more responsive to current market dynamics.
Types of Moving Average Crossovers
Implementing a Moving Average Crossover requires understanding its two main crossovers: the golden cross and the death cross.
Golden Cross: This occurs when a short-term moving average transverses upwards over a long-term moving average. It is widely perceived as a bullish indicator, signaling that a bullish trend might be unfolding as market sentiment shifts from negative to positive.
Death Cross: This is the diametric opposite of the golden cross, occurring when a short-term moving average crosses downward below a long-term moving average. It reflects a bearish sentiment, indicating that a downward price trend might be emerging as market conditions weaken.
Implementing the Strategy
To execute the Moving Average Crossover Strategy effectively, traders generally adhere to a systematic approach involving several steps:
Step 1: Selection of appropriate moving average timeframes is critical. A commonly used pair is the 50-day SMA for short-term trends and the 200-day SMA for longer-term trends.
Step 2: Traders vigilantly examine the interactions between these selected moving averages. A buy signal is considered when the short-term moving average crosses above the long-term moving average. Conversely, a sell signal is suggested when the short-term moving average crosses below the long-term moving average.
Step 3: Given the possibility of false signals—situations where a crossover does not result in a sustained trend—traders often corroborate signals with additional technical indicators. Tools like the Relative Strength Index (RSI) or volume analysis provide supplementary insights, increasing the confidence in a trading signal and reducing the likelihood of making decisions based on flawed assumptions.
Advantages and Limitations
Advantages: One of the main benefits of the Moving Average Crossover Strategy is its simplicity, making it accessible to traders regardless of their experience level. Its straightforward nature ensures ease of interpretation, allowing traders to readily identify potential entry and exit points in market transactions. Furthermore, its versatility means it is applicable across various timeframes, catering to multiple trading styles, whether short-term day trading or long-term investing.
Limitations: Despite its appealing simplicity and wide usage, this strategy is not without its limitations. The strategy is susceptible to generating false signals, particularly in choppy or highly volatile market conditions where prices oscillate frequently around the moving averages. Moreover, as moving averages are inherently lagging indicators, they may not adequately capture abrupt market reversals or unexpected price movements. Consequently, traders should enhance this strategy with additional analysis and robust risk management measures.
Conclusion
In summary, the Moving Average Crossover Strategy constitutes a fundamental component of technical analysis for many traders looking to identify potential trend reversals. While its approach is linear and straightforward, requiring merely the observation of moving average interactions, it requires cautious application. To mitigate its inherent limitations, traders are encouraged to corroborate crossover signals with other technical indicators and maintain disciplined risk management practices. For further insights into technical analysis or to examine a wider array of trading strategies, consider visiting an informative resource for more enriched learning.
This article was last updated on: July 7, 2025